No products in the cart.
When do people buy dog treats – by day and month in Australia, Google data 2016


And that is because a dogs metabolism increases dramatically in colder weather to increase body temperature to keep the cold at bay.
There are special retail data organisations that charge a fortune to get dog food sales data, but they would have difficulty gaining proper dog treat information.
This is because we suspect that mostly low quality dog treats are sold in super markets and a good percentage of the dog treat buying is done online these days. IN the following analysis we show which days of the week and which months of the year are the biggest dog treat buy days.
Dog Treats Demand trends in Australia 2012-2016
The term ‘dog treats’ is the biggest single term related to people buying dog treats, so analysing google trends data on this is useful in understanding potential DEMAND for dog treats in Australia.
The following graph shows that data in two forms:
1. Dog Treats relative Google searches 2012-2016
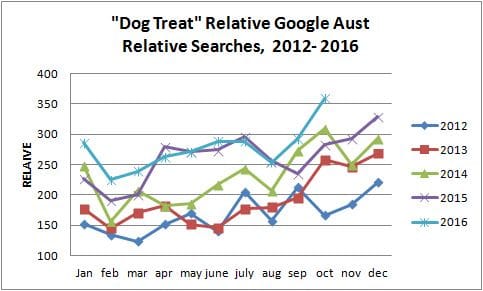
The graph below shows Google trends data on google.com.au for 2012 – 2016 by the month. The y-axis is relative google values, not absolute searcher numbers. What it shows is that there has been a dramatic increase in search numbers between 2012 and 2016 with 2016 numbers close to TWICE that of 2012 for any month.

2. Dog treats – Normalised Google relative Demand in Australia
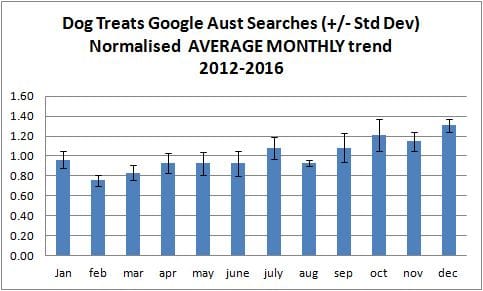
This graph below is just another representation of Google raw data, It is created by dividing each month by the average monthly value for each year. This means that each year is easier to compare to other years since every year will have an average Y axis value of 1.0.
This graph clearly shows that most years general growth trends are similar to each other. There are obvious changes in each month between years ie June 2012 compared to June 2016. However those changes for any one month are typically much less than between different months such as February compared to November for any year.
2016 last data value is currently for October but it shows that October is equally as high as the previous two years of 2013 and 2014.

The graphs show that for the last five years that February is by far the lowest demand month for people searching on google austrlia for dog treats, and that August every year a pronounced downturn occurs. The February drop in demand is beleieved to be post Christmas payback related.
The mini peak in July might be people having their dogs inside, not going for as many walks and guilt rewarding.
Every year there is a general growth in demand throughout the year from January to December. This is not so much because each month by itself is increasing in demand throughout the year, but because the whole market is on a positive trend year on year. I have added a trend line for the last five years. I have added a trend-line that shows that for the five years to date (October 2016) that the dog treats market has been growing at 3.2 % per year.
Dog Treats MONTHLY Trend 2012-2016

The graph above is created by normalising the data (dividing each year by the year average) then averaging each month for the five years. This means that on average the data will have a value of 1.0. Any value above or below that can be calculated as a percentage above or below average monthly trends for five years.
For instance February is the lowest demand month on Google Australia and demand (and most likely sales) is typically 25% below monthly average for the year.
Their is a mini peak in July but that is only about 8% above the monthly average. August to September sees a surge in demand and sales, with a mini dip usually around November as demand stalls before buying up for Christmas. December on average is 30% above average monthly demand and sales. The standard deviateion bars on the graphs suggest that the data sets and trends are suprisingly robust (repeatable) for each year.
Dog Treats DAILY Demand Sept – Oct 2016
The graph below shows data for 13weeks leading up to mid November 2016.

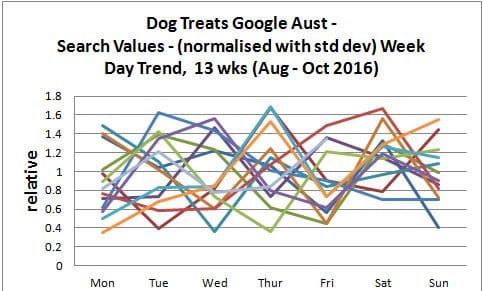
The graph as been normalised (each weekly search demand value on Google Australia divided by the average demand value for that week.
You will see that for 13 weeks there appears to be no clear trend. That is because at this micro level, search robots, people researching rather than looking to buy dog treats etc are adding to the noise of the data. And because it is possible that there is no significant daily demand trend for dog treats on any particular day of the week.
The graphs does show that demand typically is about 60% down on average for random days of the week and can be as high as 70% above weekly demand (google searches) on a given day.
Dog Treats Google search WEEK DAY TREND Aug – Oct 2016

The graph above is a little bit of a cheat, considering how scattered the normalised data graphs for 13 weeks is. With normalised data, the average day search value is ONE, and for the 13 weeks the average standard deviation for all days is around 0.35. Which is nearly a third of the average value! In statistical terms, the data doesnt have a very clear trend.
However if you look at the single week averaged graph above and compare it to the normalised graph for any major peaks or troughs you can see that on average a few trends tend to exist.
Monday and Friday on average for 13 weeks were about 10% below the other days of the week.
Saturday on average searching (and buying?) is nearly 20% above demand trend of the average day of the week.
If people are buying dog treats at work, it would make sense that Thursday is higher than Friday – assuming that most people’s Fridays are hectic as they finish off the weeks work before the weekend break.
And if most people work Monday to Friday it makes sense that they might search and buy dog treats on Saturday and rest up on Sunday before the weekly work onslaught begins again.
Remember that our online store is open 24x 7 so you can buy from us any day or time of day.
The only slight delay occurs for purchases on weekends as auspost and couriers do not pick up and start the order journeys on weekends. But considering that most orders take around 5 or more days to reach customers a few days delay added by a weekend purchase does not seem to make a lot of difference in the scheme of your dogs getting the world’s best treats from our site Bruce’s healthy dog treats!


