No products in the cart.
Why 2016 is the best year for buying dog treats ever !

I put a few graphs together in the last post and explained how there is even a vague weekday trend to when people buy treats but this article looks at what the pattern for people buying dog treats online means relative to the last four years.
The graph below is from Google (Australia) data from 2012 to Oct 2016 for the term “dog treats” which is the main term in the dog treat category as far as volumes go.
As Google has over 80% market share of all browser searches in Australia, this is a good indication of what is happening in dog treats in Australia.
Even if only NEW people to the market people with a new dog, or people who have never bought treats before are putting in the keywords “dog Treats” that is fine, they are representative of the growth of the market in general or maybe even a forecast of how the market will be.
Dog Treat buying trends in Australia 2012- 2016
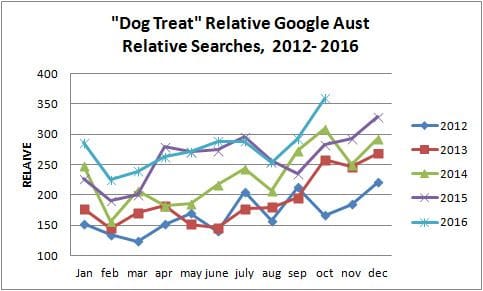
What the above graph is showing is that on a scale where they are all relative to each other the 2016 search values are approximately double what the 2012 dog treat search volumes. By 2012 the global financial crisis was over, so we are comparing like stability economies with each other. In times of credit crunch luxury items or discretionary income items tend to be bought less – but that is not having a major effect on this graph.
It is showing that people are starting to give dog treats to their dogs much more in Australia.
As 2015 is the second largest on the graph, it is clear that there is a continuous upward growth in demand for dog treats. What does this mean for you the consumer?
With increased demand there are more likely to be more suppliers entering the market.
With higher foreign ownership of cattle stations and abattoirs in Australia, coupled with a massive increase in exports of meat to china, the cost of meat to Australians has increased substantially in the last few years.
Many of the new dog treat suppliers are still selling grain based dog treats, raw hides and lots of pig skin products. Some of these are considered fine for chewing, but mostly the suppliers are selling these things because they are easy to get hold of and there is a big profit in them (low acquisition cost). Higher supply cost wont affect dog treat companies that sell mostly grain treats, but they will affect the price of meat based dog treats.
Because these new suppliers are often large corporations with a lot of advertising spend, many people are being lured into non healthy dog treat options. Especially people new to owning a dog (the kind that often search for “dog treats” and without awareness of the need for healthy dogs to eat a variety of meat), the new searchers often buy dud treats.
The dog treat seasonal trend 2016 V other years
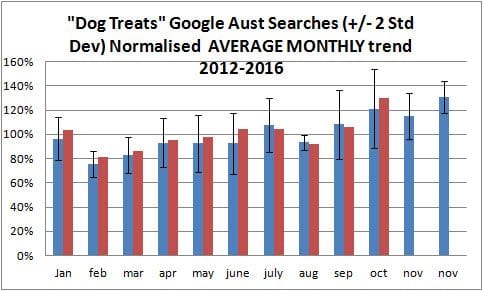
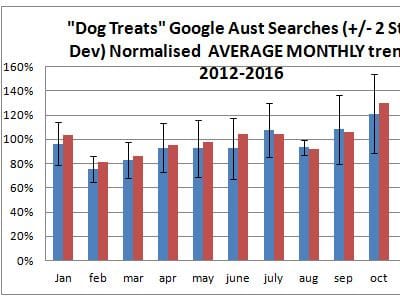
Blue column = 2012 – 2016 average trend
Black bar on blue columns = two standard deviation error bar (95%)
RED column = 2016 monthly trend until Oct
While the first graph in this article shows the clear growth trend between the years, it doesn’t show the stability of the seasonal trend. For that, I have averaged all five years (2012 to 2016) and included a TWO standard deviation error bar on the blue column. This black vertical bar represents a 95% error range for any particular month.
This approximately equates to 95% of the samples for any one month being within the max and minimum ranges of the error bar. For instance, for July the search value is about 105% (compared to the other months) and the 2 standard deviation error bar ranges between 85% and 130% – meaning that for any year only five percent of individual years used in the average could exceed these values.
To give you an idea of what this might mean to the yearly trend, consider comparing the months of February and December
Month Minimum Maximum
Feb 65% 87%
Dec 118% 144%
This means that for February that 95% of sample years would fall between search values of 65% and 87% of the average month. Even at its best search year, February would still be 13% down on the average month search number.
At the opposite end of the dog treat demand statistics is December that in its worst trend year is almost always 18% over monthly trend and up to 44% above the average monthly demand.
The wide gap between the February month max value 87% and December Minimum value of 118% means that this trend is almost ALWAYS (95% of the time) true.
How does 2016 dog treats demand compare?
Its nice to know the history of dog treat demand trends but what about right now in 2016?
The graph shows the red monthly values (2016) right next to the average blue values (2012-2016). It shows that the red values are well within the error bars for 95% confidence interval of the general average, and that 2016 is very ‘on trend’ to have a similar bumper demand period in December 2016.
The reason that almost all of the red columns are slightly above each blue column is because the BLUE columns are only averaged against the first ten months of 2016 (that is all the data we currently have). When the year is complete and Nov and Dec 2016 are averaged in, many of the red columns will be about the same or slightly less than the blue column average.
The trend comparison of 2016 to the average of the last five years shows how strong this trend is each year (including standard deviation 95% error values). And that its likely that December 2016 will have about 30% higher demand (online searches) for dog treats than the average month for the year.

